class-12
Chart.js
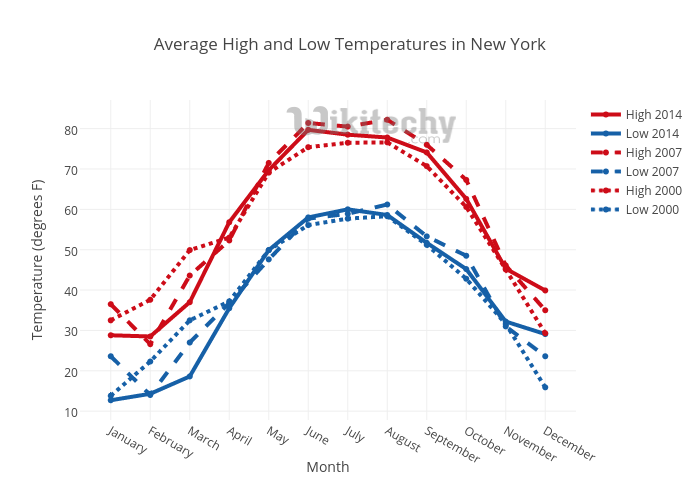
Charts are far better for displaying data visually than tables and have the added benefit that no one is ever going to press-gang them into use as a layout tool.

A great way to get started with charts is with Chart.js, a JavaScript plugin that uses HTML5’s canvas element to draw the graph onto the page. All that’s required is the script included in your page along with a single canvas node to render the chart.
there are some steps to use and create chart
- Setting up: The first thing we need to do is download Chart.js. Copy the Chart.min.js out of the unzipped folder and into the directory you’ll be working in. Then create a new html page and import the script
- Drawing a chart: To draw a chart, the first thing we need to do is create a canvas element in our HTML in which Chart.js can draw our chart. So add this to the body of our HTML page
- Next, we need to write a script that will retrieve the context of the canvas, so add this to the foot of your body element
- Inside the same script tags we need to create our data, in this instance it’s an object that contains labels for the base of our chart and datasets to describe the values on the chart.

You can choose any type of chart you want.

The great things about Chart.js are that it’s simple to use and really very flexible.
Basic usage of canvas
At first sight a canvas looks like the img element, with the only clear difference being that it doesn’t have the src and alt attributes. Indeed, the canvas element has only two attributes, width and height. These are both optional and can also be set using DOM properties. When no width and height attributes are specified, the canvas will initially be 300 pixels wide and 150 pixels high. The element can be sized arbitrarily by CSS, but during rendering the image is scaled to fit its layout size: if the CSS sizing doesn’t respect the ratio of the initial canvas, it will appear distorted.
The canvas element can be styled just like any normal image (margin, border, background…).
The rendering context
The canvas element creates a fixed-size drawing surface that exposes one or more rendering contexts, which are used to create and manipulate the content shown. In this tutorial, we focus on the 2D rendering context. Other contexts may provide different types of rendering
The canvas is initially blank. To display something, a script first needs to access the rendering context and draw on it. The canvas element has a method called getContext(), used to obtain the rendering context and its drawing functions. getContext() takes one parameter, the type of context.
.png)
Drawing shapes with canvas

Unlike SVG, canvas only supports two primitive shapes: rectangles and paths (lists of points connected by lines). All other shapes must be created by combining one or more paths. Luckily, we have an assortment of path drawing functions which make it possible to compose very complex shapes.
- fillRect(x, y, width, height): Draws a filled rectangle.
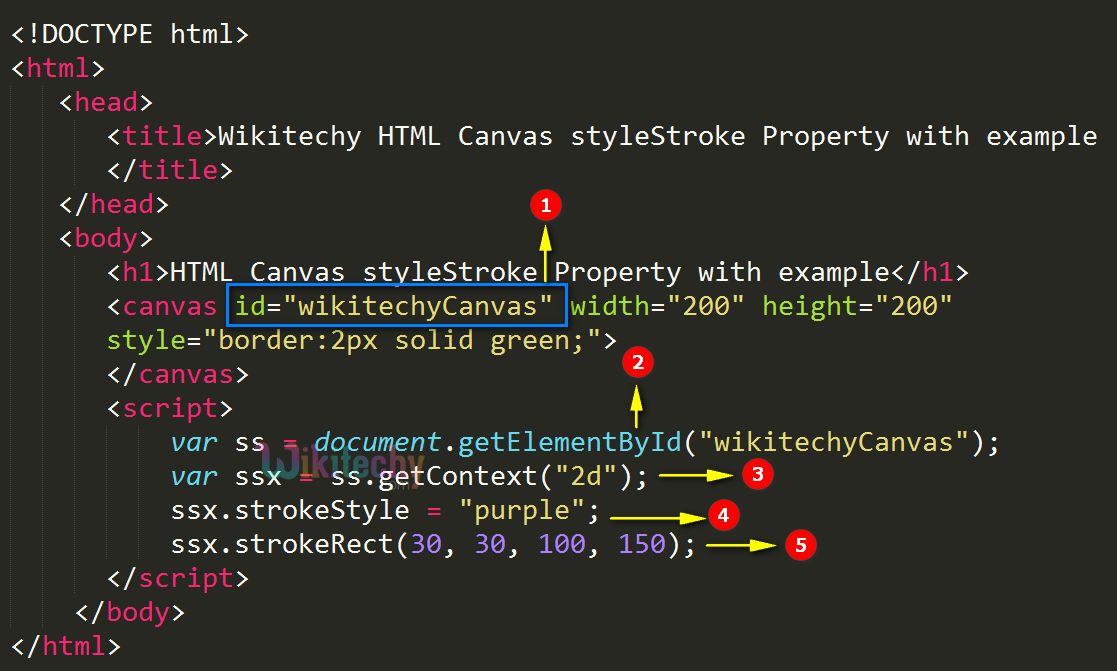
- strokeRect(x, y, width, height) Draws a rectangular outline.
- clearRect(x, y, width, height) Clears the specified rectangular area, making it fully transparent.
Drawing paths
A path is a list of points, connected by segments of lines that can be of different shapes, curved or not, of different width and of different color. A path, or even a subpath, can be closed. To make shapes using paths, we take some extra steps:
- First, you create the path.
- Then you use drawing commands to draw into the path.
- Once the path has been created, you can stroke or fill the path to render it. Here are the functions used to perform these steps:
- beginPath(): Creates a new path. Once created, future drawing commands are directed into the path and used to build the path up.
- Path methods: Methods to set different paths for objects.
- closePath(): Adds a straight line to the path, going to the start of the current sub-path.
- stroke():Draws the shape by stroking its outline.
*fill(): Draws a solid shape by filling the path’s content area.
Lines
For drawing straight lines, use the lineTo() method.
- lineTo(x, y): Draws a line from the current drawing position to the position specified by x and y.
Path2D objects
The Path2D() constructor returns a newly instantiated Path2D object, optionally with another path as an argument (creates a copy), or optionally with a string consisting of SVG path data.
Applying styles and colors
Colors
If we want to apply colors to a shape, there are two important properties we can use: fillStyle and strokeStyle.
- fillStyle = color: Sets the style used when filling shapes.
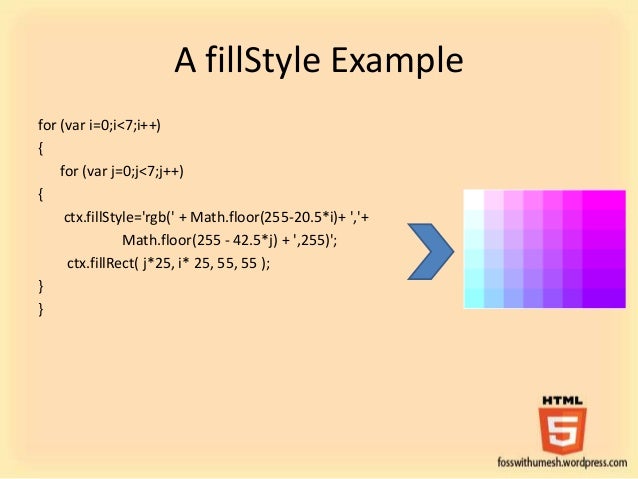
- strokeStyle = color: Sets the style for shapes’ outlines.
color is a string representing a CSS color, a gradient object, or a pattern object. We’ll look at gradient and pattern objects later. By default, the stroke and fill color are set to black (CSS color value #000000).
Transparency
In addition to drawing opaque shapes to the canvas, we can also draw semi-transparent (or translucent) shapes. This is done by either setting the globalAlpha property or by assigning a semi-transparent color to the stroke and/or fill style.
Line styles
There are several properties which allow us to style lines.
- lineWidth = value: Sets the width of lines drawn in the future.
- lineCap = type: Sets the appearance of the ends of lines.
- lineJoin = type: Sets the appearance of the “corners” where lines meet.
- miterLimit = value: Establishes a limit on the miter when two lines join at a sharp angle, to let you control how thick the junction becomes.
- getLineDash(): Returns the current line dash pattern array containing an even number of non-negative numbers.
- setLineDash(segments): Sets the current line dash pattern.
- lineDashOffset = value: Specifies where to start a dash array on a line.
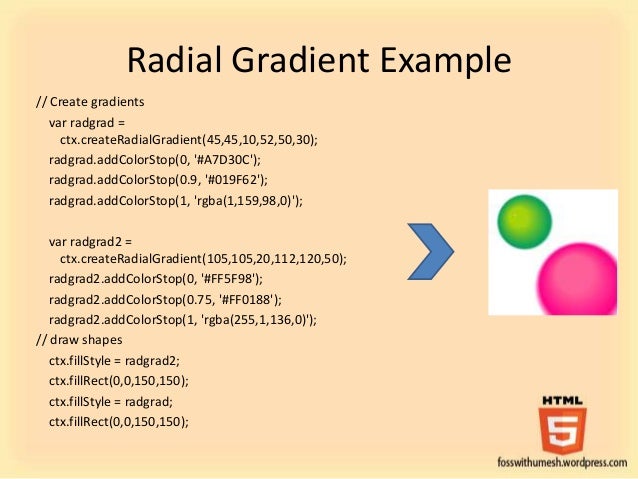
Gradients
*Just like any normal drawing program, we can fill and stroke shapes using linear, radial and conic gradients. We create a CanvasGradient object by using one of the following methods. We can then assign this object to the fillStyle or strokeStyle properties.
createPattern(image, type)
Creates and returns a new canvas pattern object. image is a CanvasImageSource (that is, an HTMLImageElement, another canvas, a video element, or the like. type is a string indicating how to use the image.
Shadows
Using shadows involves just four properties:
- shadowOffsetX = float: Indicates the horizontal distance the shadow should extend from the object. This value isn’t affected by the transformation matrix. The default is 0.
- shadowOffsetY = float: Indicates the vertical distance the shadow should extend from the object. This value isn’t affected by the transformation matrix. The default is 0.
- shadowBlur = float: Indicates the size of the blurring effect; this value doesn’t correspond to a number of pixels and is not affected by the current transformation matrix. The default value is 0.
- shadowColor = color: A standard CSS color value indicating the color of the shadow effect; by default, it is fully-transparent black.
Canvas fill rules
When using fill (or clip and isPointInPath) you can optionally provide a fill rule algorithm by which to determine if a point is inside or outside a path and thus if it gets filled or not. This is useful when a path intersects itself or is nested.
Drawing text
The canvas rendering context provides two methods to render text:
- fillText(text, x, y [, maxWidth]): Fills a given text at the given (x,y) position. Optionally with a maximum width to draw.
- strokeText(text, x, y [, maxWidth]): Strokes a given text at the given (x,y) position. Optionally with a maximum width to draw.

Styling text
In the examples above we are already making use of the font property to make the text a bit larger than the default size. There are some more properties which let you adjust the way the text gets displayed on the canvas:
- font = value: The current text style being used when drawing text. This string uses the same syntax as the CSS font property. The default font is 10px sans-serif.
- textAlign = value: Text alignment setting. Possible values: start, end, left, right or center. The default value is start.
- textBaseline = value: Baseline alignment setting. Possible values: top, hanging, middle, alphabetic, ideographic, bottom. The default value is alphabetic.
- direction = value: Directionality. Possible values: ltr, rtl, inherit. The default value is inherit.
 These properties might be familiar to you, if you have worked with CSS before.
Advanced text measurements
In the case you need to obtain more details about the text, the following method allows you to measure it.
- measureText(): Returns a TextMetrics object containing the width, in pixels, that the specified text will be when drawn in the current text style.
Gecko-specific notes
In Gecko (the rendering engine of Firefox, Firefox OS and other Mozilla based applications), some prefixed APIs were implemented in earlier versions to draw text on a canvas. These are now deprecated and removed, and are no longer guaranteed to work.