Error Handling & Debuggin
ORDER OF EXECUTION
To find the source of an error, it helps to know how scripts are processed. The order in which statements are executed can be complex; some tasks cannot complete until another statement or function has been run:
- EXECUT.ION CONTEXTS
The JavaScript interpreter uses the concept of execution contexts. There is one global execution context; plus, each function creates a new new execution context. They correspond to variable scope.
EXECUTION CONTEXT & HOISTING:
Each time a script enters a new execution context, there are two phases of activity:
- PREPARE
- The new scope is created
- Variables, functions, and arguments are created
- The value of the this keyword is determined
- EXECUTE
- Now it can assign values to variables
- Reference functions and run their code
- Execute statements

UNDERSTANDING SCOPE
In the interpreter, each execution context has its own va ri ables object. It holds the variables, functions, and parameters available within it. Each execution context can also access its parent’s v a ri ables object.
UNDERSTANDING ERRORS
If a JavaScript statement generates an error, then it throws an exception. At that point, the interpreter stops and looks for exception-handl ing code.
ERROR OBJECTS
Error objects can help you find where your mistakes are and browsers have tools to help you read them.
HOW TO DEAL WITH ERRORS
Now that you know what an error is and how the browser treats them, there are two things you can do with the errors.
DEBUG THE SCRIPT TO FIX ERRORS If you come across an error while writing a script (or when someone reports a bug), you will need to debug the code, track down the source of the error, and fix it
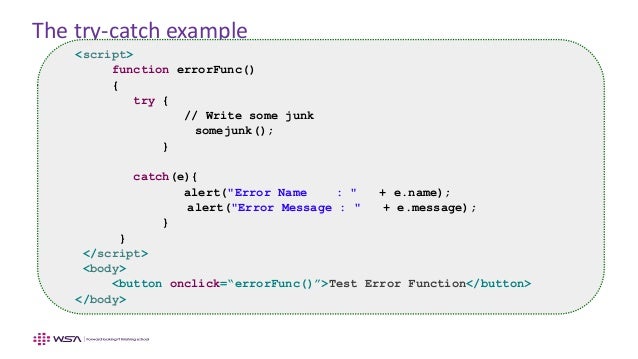
2: HANDLE ERRORS GRACEFULLY You can handle errors gracefully using try, catch, throw, and finaly statements. Sometimes, an error may occur in the script for a reason beyond your control. For example, you might request data from a third party, and their server may not respond. In such cases, it is particularly important to write error-handling code.
Debugging
is about deduction: eliminating potential causes of an error.

BROWSER DEV TOOLS & JAVASCRIPT CONSOLE
The JavaScript console will tell you when there is a problem with a script, where to look for the problem, and what kind of issue it seems to be.
- The JavaScript console is just one of several developer tools that are found in all modern browsers. HOW TO LOOK AT ERRORS IN CHROME The console will show you when there is an error in your JavaScript. It also displays the line where it became a problem for the interpreter.
TYPING IN THE CONSOLE IN CHROME
You can also just type code into the console and it will show you a result.
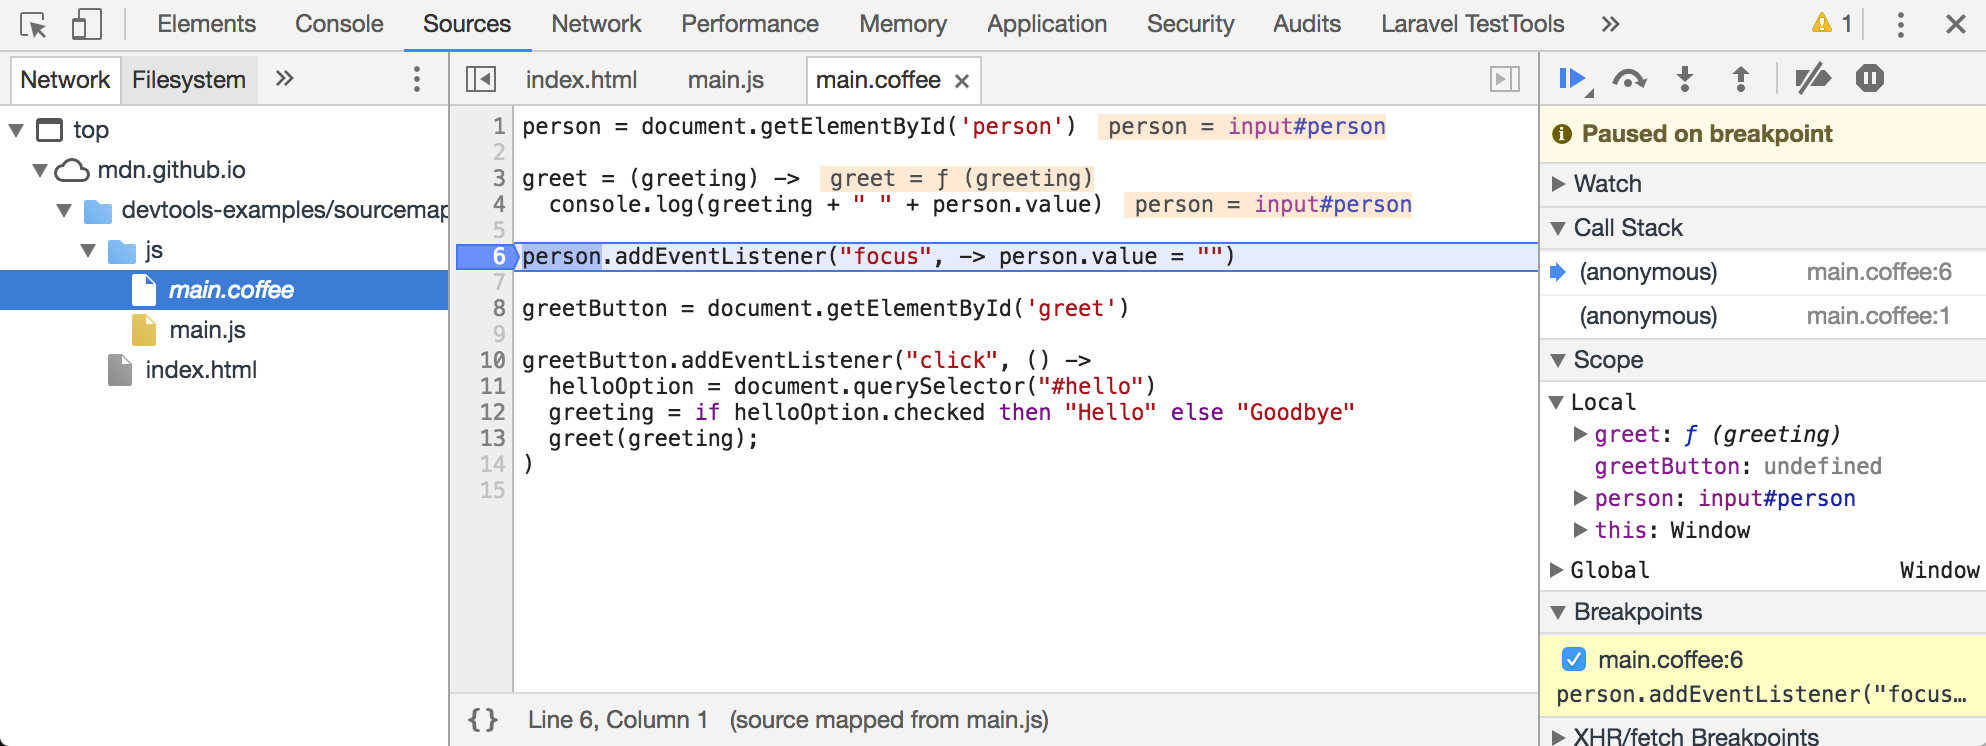
BREAKPOINTS
You can pause the execution of a script on any line using breakpoints. Then you can check the values stored in variables at that point in time.
STEPPING THROUGH CODE
If you set multiple breakpoints, you can step through them one-by-one to see where values change and a problem might occur.
CONDITIONAL BREAKPOINTS
You can indicate that a breakpoint should be triggered only if a condition that you specify is met. The condition can use existing variables.
HANDLING EXCEPTIONS
If you know your code might fail, use try, catch, and finally. Each one is given its own code block.
THROWING ERRORS
If you know something might cause a problem for your script, you can generate your own errors before the interpreter creates them.
THROW ERROR FOR NaN :
If you try to use a string in a mathematical operation (other than in addition), you do not get an error, you get a special value called NaN (not a number).
JavaScript has 7 different types of errors. Each creates its own error object, which can tell you its line number and gives a description of the error.